GIS 580 : SPATIAL BUSINESS INTELLIGENCE
EXERCISE # 2. PROJECT 2
Student : Sushmita Goswami Professor : Sergei Andronikov / Sara Hummell
Due Date : 05/09/2016
Submission Date : 05/06/2016
Student : Sushmita Goswami Professor : Sergei Andronikov / Sara Hummell
Due Date : 05/09/2016
Submission Date : 05/06/2016
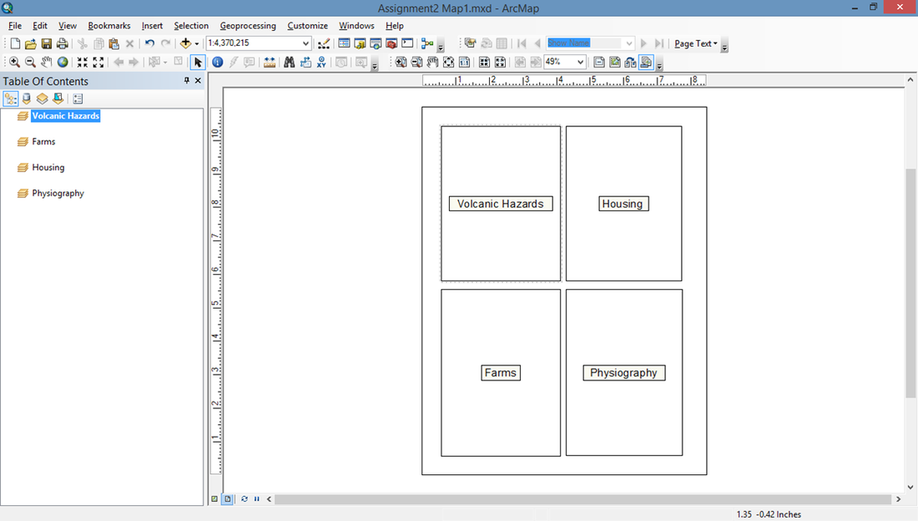
Map 1.) Start with a new blank map using Letter (ANSI A) Landscape template. Create four data frames, each of which takes up a quarter of the page. Name them Volcanic Hazards, Farms, Housing and Physiography.
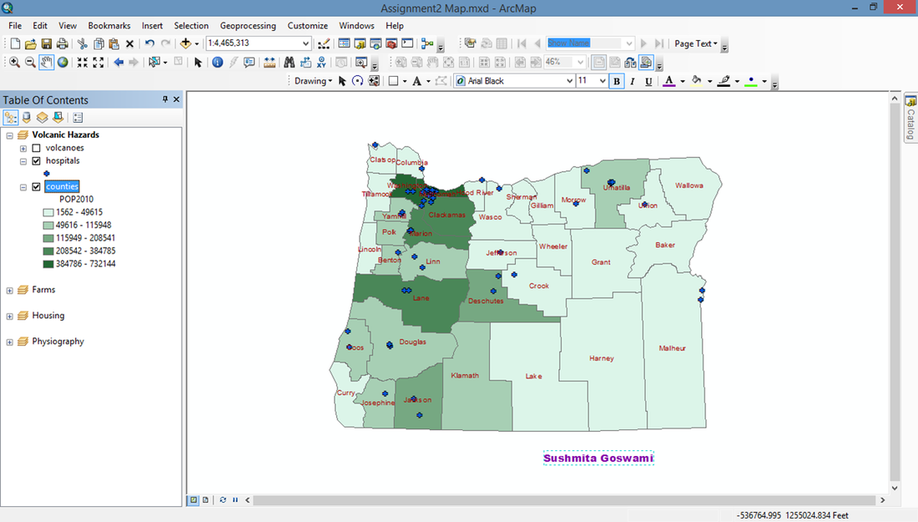
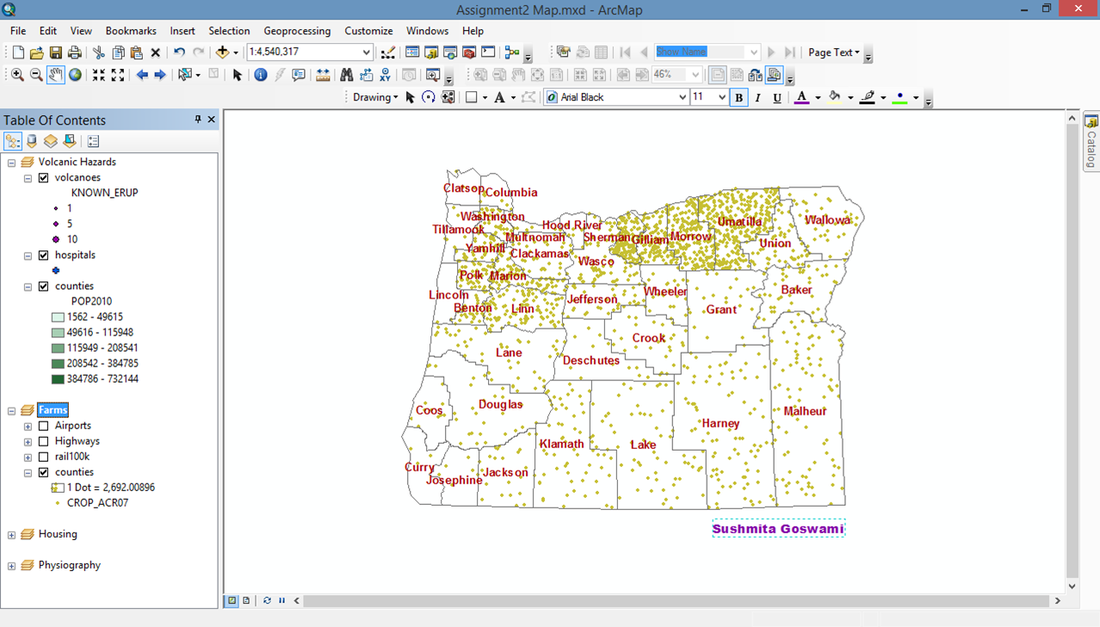
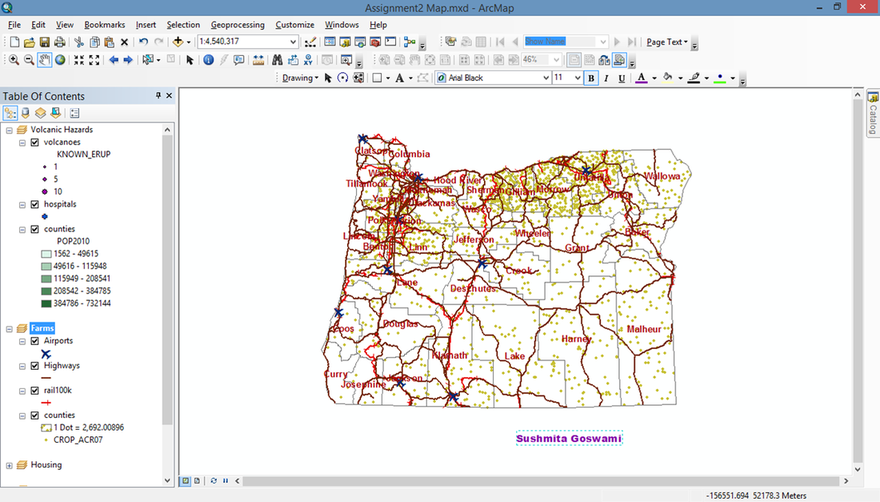
Map 2.) Create a map showing the population density of the counties. Also show the hospitals, marked with blue crosses.
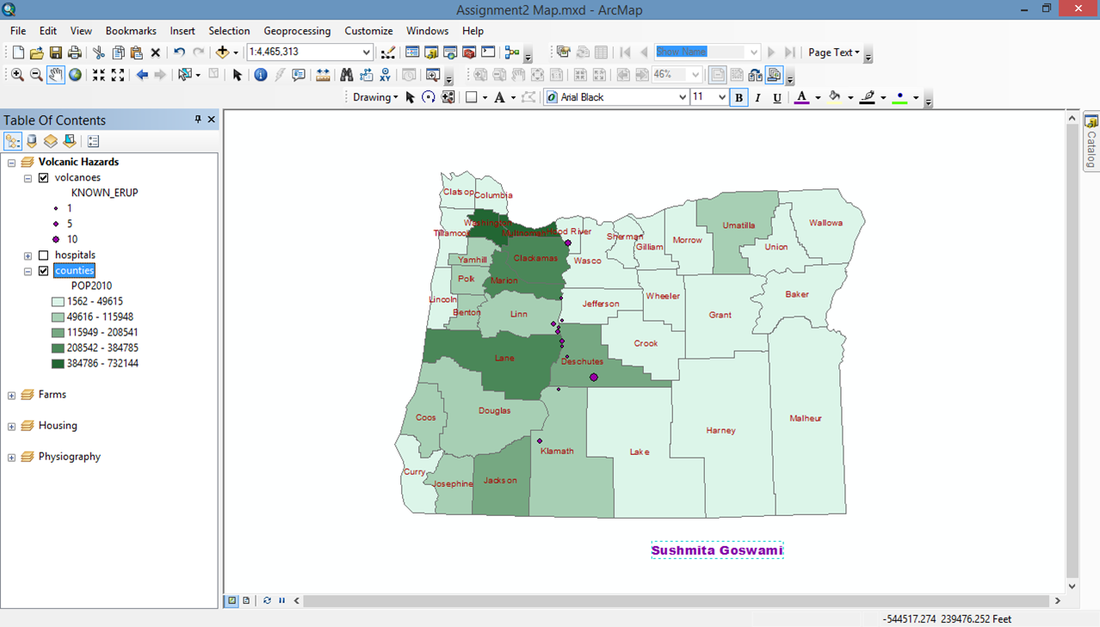
Map 3.) Create a proportional symbol map of the volcanoes based on the KNOWN_ERUP fields.
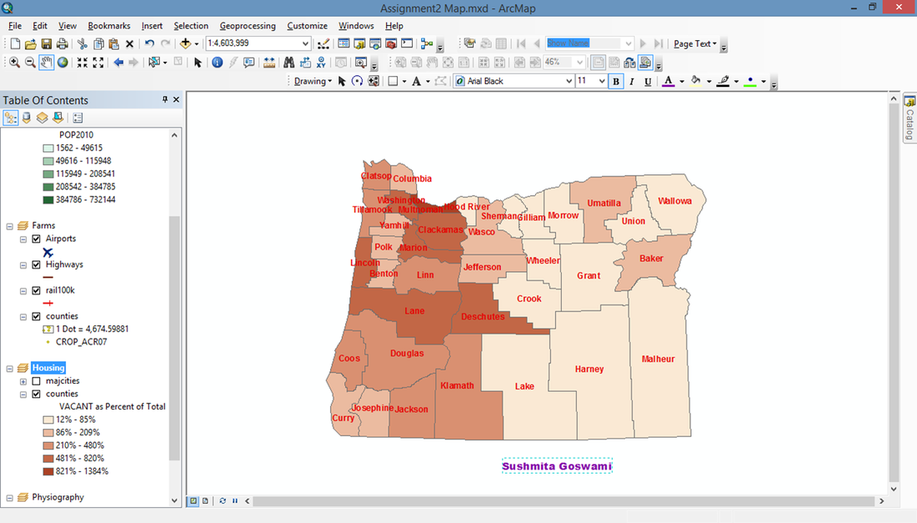
Map 4.) Create a map of counties showing the density of farms. Label the county names.
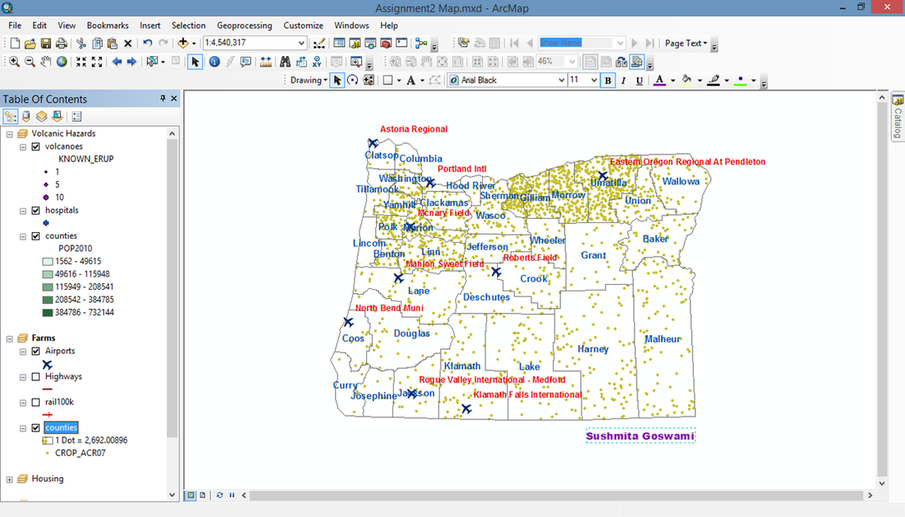
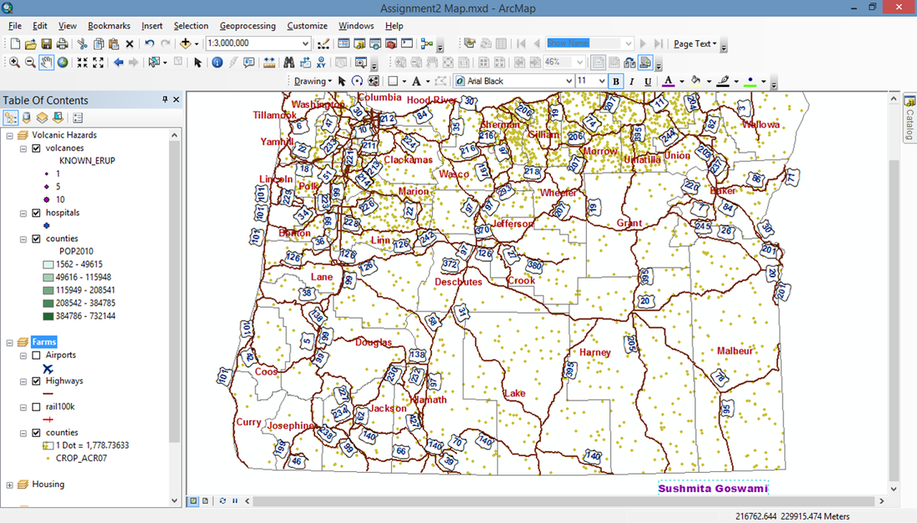
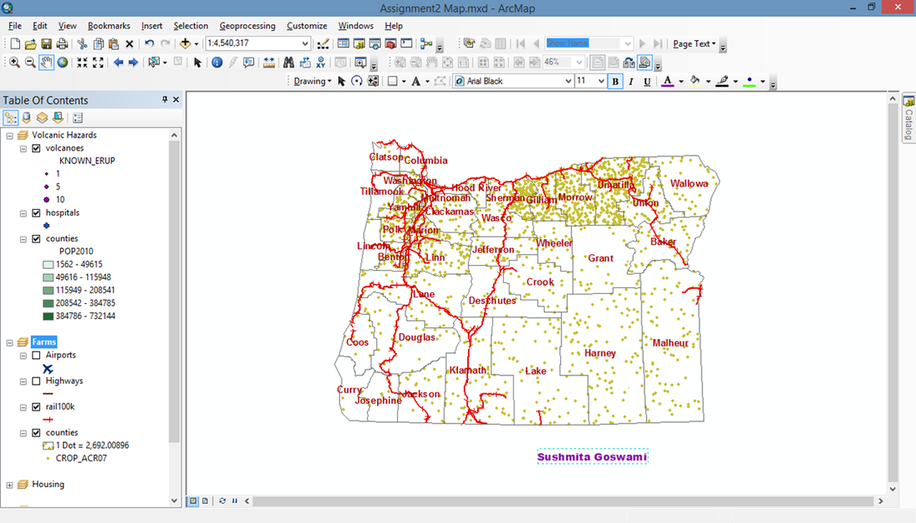
Map 5.) Create a map showing the transportation routes, symbolized by type (Air/Roadtype/Rail).
Map 6.) Create a map showing the vacancy rate of the counties. What would you normalize by in this case? Label the county names.
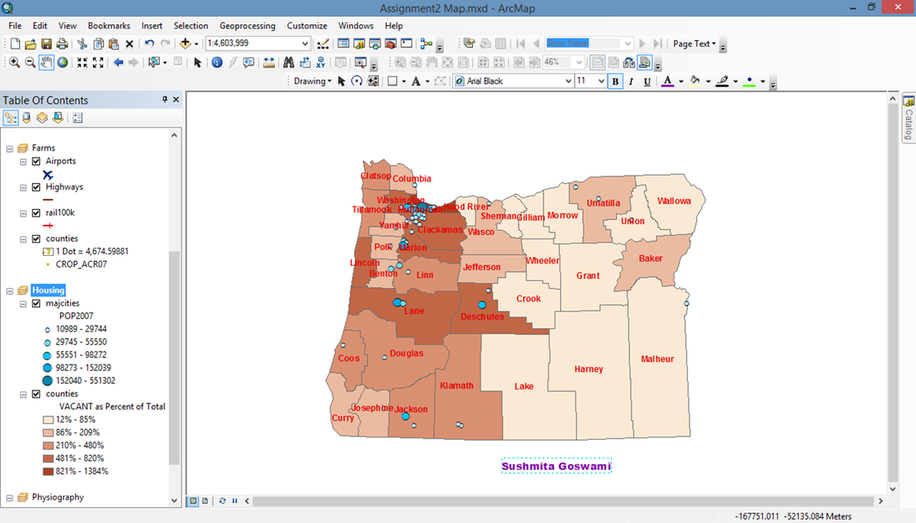
Map 7.) Show the major cities feature class (majcities) symbolized by population.
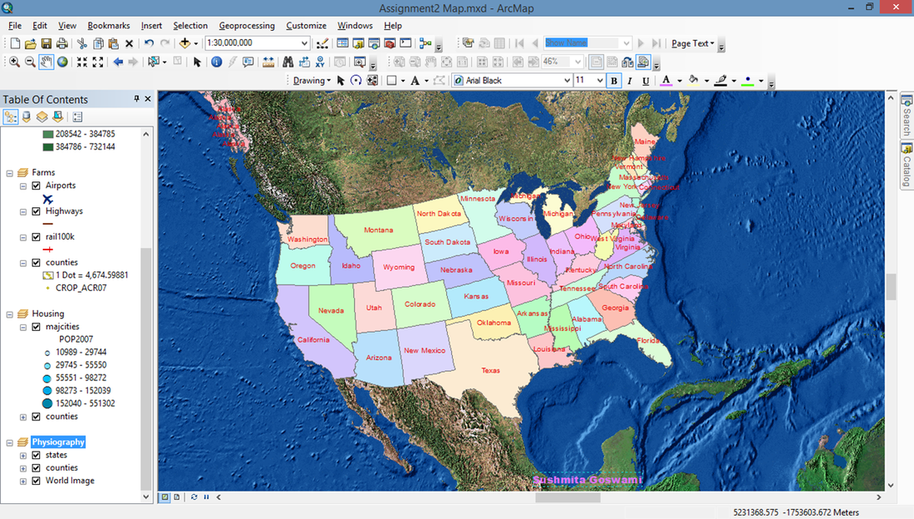
Map 8.) Add the state boundary and the county boundaries, and then add the World Imagery service from ArcGIS Online. Use a hollow symbol and a contrasting outline color for the state and county boundaries so that you can see them well against the imagery.
Map 9.) Examine the legends in the Table of Contents. Make sure you used good classification schemes, rounded label values, and used appropriate significant digits or decimal places. Be sure that each layer has an informative capitalized name.
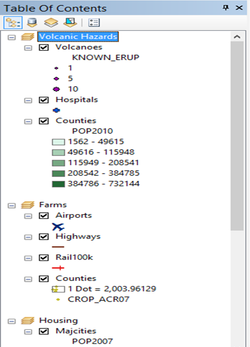
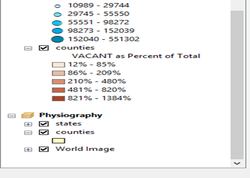
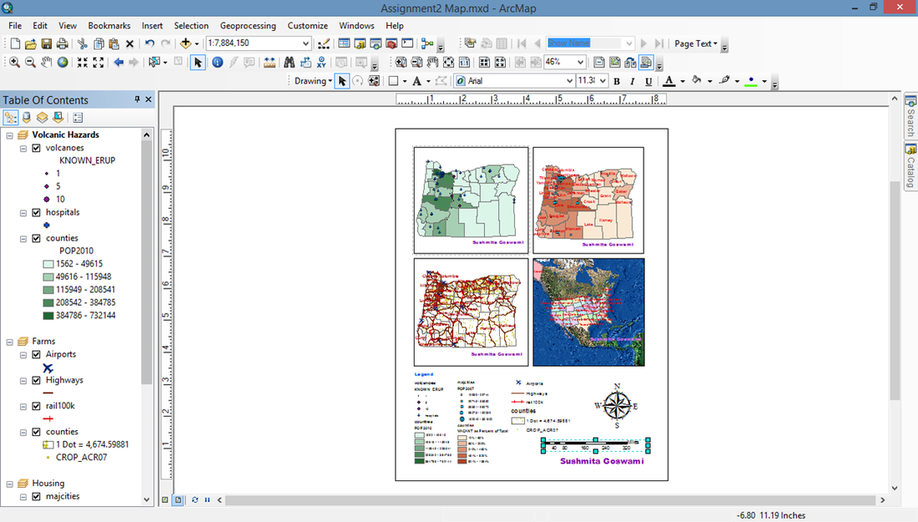
Map 10.) Capture a screen shot of each data frame in Data View, including the Table of Contents showing the corresponding legends to each frame. Also capture a screen shot of the entire layout with all four frames.